Sometimes, a seemingly small or isolated action can have far-reaching consequences—for good or ill. When discovered through analysis, the butterfly effect tends to be startling, whether you’re talking about a natural ecosystem or an LTE Advanced mobile network.
Take the “trophic cascade” that occurred in Yellowstone National Park when wolves were reintroduced to the ecosystem in 1995, after being absent for 70 years. Through a series of interdependencies, the presence of the wolves actually changed the course of rivers in the park!
That’s a top-down sort of butterfly effect example. A more isolated one, and perhaps more relevant for the telecom industry because it involves technology, would be a single broken stop light or accident on a particular city street bringing everything to a halt because of the way traffic patterns are set up.
Even more relevant are some of the surprising correlations that distributed, virtualized network assurance testing, combined with big data analytics, are turning up in LTE-A networks. Light Reading’s senior editor for test & measurement, Brian Santo, explored some of those in a recent article, using examples from Scott Sumner, Accedian VP of Strategic Marketing.
Time for an upgrade?
First example: An operator in India had almost half its VoLTE calls in entire city sectors drop every 14 minutes. Every metric being measured was well below the threshold for triggering alarms (e.g. packet loss was at less than 0.2%, where alarm trigger was set to 2%). Yet, there was a 95% correlation between packet loss, delay ‘bursts’, and call drops.
The carrier took all metrics available from Accedian instrumentation—more than 20 billion records in total, comprising statistical variation of jitter, class of service, MOS, packet loss and VoLTE QoE scores—and correlated them against each other using their big data analytics platform.
That comparison revealed:
- MOS problems correlated only to packet loss
- Packet loss correlated 100% to loss burst—loss of packets in a row
- Delay did not correlate with MOS, but “Max Delay” over the span between call drops did—indicating a possible spike in delay at the time of failure
This data was combined with information from routers and network switch CPUs, and run through a big data analysis system.
This revealed that the loss bursts correlated 100% with particular routers’ loss during ring switching—switching from one side of a ring to the other. This operation, which should normally take less than 50ms to be transparent to VoLTE calls, was taking more than twice that long. The operator went on to correlate this with the firmware versions of impacting vs properly performing routers: all failure points had an outdated firmware installed. With the upgrades performed, the network was back to normal, and callers were back in business.
The problem in this case could never have been solved without analytics, because it involved crunching hundreds of billions of records, and revealed a relationship that would have been nearly impossible to detect. Detecting 100ms of packet loss is hard enough to do, but correlating it with voice QoE, network topology, and network elements and their software version is a ‘needle in a haystack scenario’.
Strange new correlations
Very fine-grained metrics, crunched by big data analytics, are turning up some other, surprising, correlations in LTE-A networks between previously unrelated performance factors. A few other examples from the Light Reading article:
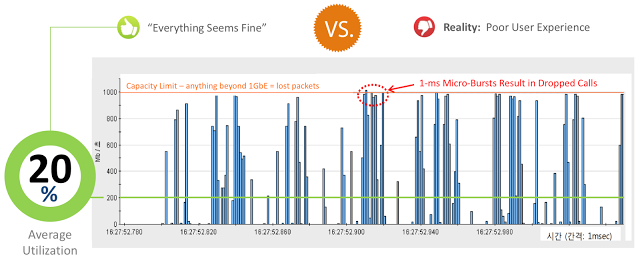
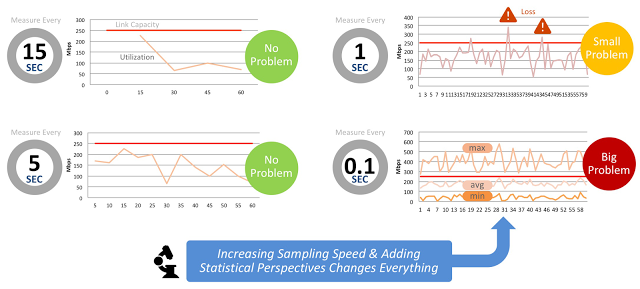
Mobile backhaul – SK Telecom’s network was experiencing packet loss, leading to performance degradation and dropped calls. But, the network had capacity to spare—it was running at only 20% average utilization. The operator started measuring backhaul network utilization every tenth of a second, rolled into 1-second samples. This granularity revealed microbursts only in financial networks. Inter-cell communication was causing 1ms microbursts that exceeded the network’s total capacity, leading to packet loss.
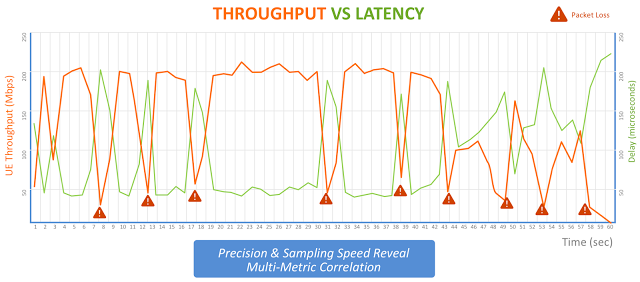
Antennas again – A Tier-1 operator in Japan was experiencing call throughput oscillations swinging from 200Mbit/sec to almost none and back in the space of a second. They figured out the cause by charting latency against throughput performance, at microsecond scale. This revealed 20-microsecond delays correlated 100% with throughput loss. It turned out the issue was caused by the way antennas were configured in MIMO mode. Spikes in delay resulted in signaling message transmissions getting skewed, causing packets to interfere with each other.
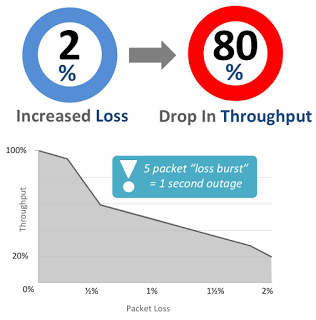
Packet loss = outage – An operator found that losing five packets in a minute was no problem, but losing five packets in a row would cause a 1-second outage on data throughput. This meant that a mere 2% of packet loss could potentially knock down throughput by 80%.
These examples illustrate that LTE-A can be unexpectedly finicky, and that big data analytics can help solve baffling problems in these networks. In particular, big data is useful for identifying LTE-A network characteristics that previously were thought to have little or no relationship to each other.
Analytics systems themselves, however, are no good without the right data to analyze. Virtualized network instrumentation, especially that which is capable of capturing metrics in a very precise and granular manner (think microsecond precision and subsecond granularity) can contribute significantly toward the troubleshooting effort when analytics are put to work solving performance and customer experience issues.
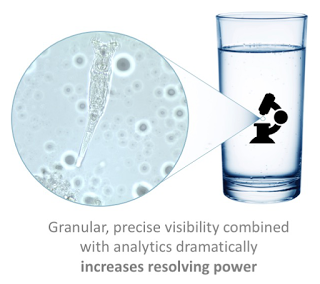
We need a better microscope
In a way, the correlations that can be uncovered using such granular data in an analytics system is not unlike the way the germ theory was validated, transforming modern medicine. Its discovery can be credited in part to precise microscope technology, proving that sometimes, until the right tools are available, you don’t even know what to look for or would be unable to see and definitively prove a hypothesis.
In the mid-1800s, the work of scientists like Edward Jenner and doctors like Ignaz Philipp Semmelweiss gave rise to the idea that diseases might be caused by infectious agents, or germs. But, it was the later development of microscopic techniques that enabled people to actually see those germs, and therefore for Louis Pasteur and others to prove the theory correct.
Proving the germ theory also validated conclusions made by British doctor John Snow about how cholera spread and the sources of infection. (He faced an uphill battle getting officials to take action based on his pioneering public health research; a microscope allowing cholera bacteria to be seen, invented later, would surely have helped.)
Back to modern day: because LTE-A networks tend to be unpredictable, and because capacity demands continue to increase, a more powerful microscope is needed, so to speak, to see what’s going on and understand how metrics are correlating in new ways. Without knowing the cause, it’s hard or impossible to solve a problem.
Related

 Improved delivery, better visibility: How Accedian and VMware are working together to help CSPs navigate the 5G world
 Adding a new dimension of visibility to the Cisco Full-Stack Observability portfolio with Accedian Skylight

