 Cloud Visibility
 Application Performance
 Network Performance Optimization
 Security
 Industries
 Platform
 About Us
 Learn
Learn
 Blogs
Blogs
 Improved delivery, better visibility: How Accedian and VMware are working together to help CSPs navigate the 5G world
 Adding a new dimension of visibility to the Cisco Full-Stack Observability portfolio with Accedian Skylight
 Tools & Support
When troubleshooting slow applications, I see two main reasons for which we typically blame the network.
They are:
- The first reason comes down to history: in the 1990s and 2000s, the network was often the bottleneck and people got used to saying “the network is slow”
- The second reason is more complex and related to how organizations or their IT departments are structured; let’s focus on this one!
Looking for an explanation to that, we will review how performance issues are handled inside the IT department to end up in the network/infrastructure group.
Why troubleshooting slow applications implies the network team and not another group inside IT?
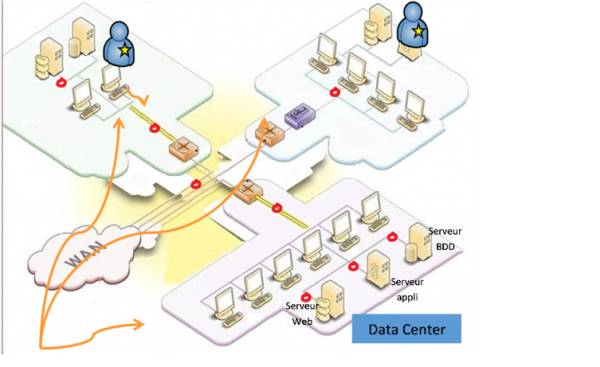
The network group is transversal by definition: all application flows go through the network (see the red dots in the diagram above) and the network is one of the few IT elements which can be the root cause of a slowdown associated with:
- One application
- One or several sites
- One datacenter
- A cloud service
- A user
- A server
- Several applications…
Whatever the organization’s structure, how well the IT groups work together, in most cases, the network group will be in charge of troubleshooting slow applications.
Different types of application slowdowns
Let’s analyze how complaints are processed depending on the type of degradation and the type of users:
- For a punctualslowdown on a given application, the end user will reach to:
- The help desk
- The network/infrastructure team for small organizations
- Rarely to the application team
- For a recurring performance degradation, the process will vary as it went through the helpdesk several times and its handling will go directly to the network group.
- If the degradation impacts the Business Operations, the network group will lead the troubleshooting and in some rare cases involve the development team.
- If the degradation impacts some executives, in the same way, it will be directed to the network team
Whatever happens, the network team will handle performance degradation cases, even though the root cause is more likely to be found elsewhere.
The real causes for an application slowdown
According to a survey realized amongst our customers, the most common sources for application slowdowns are:
- Overloaded server
- Database request too slow to execute or poorly written
- Issues at the load balancing level (overloading one server)
- Slow Web request
- Slow application code execution
- DNS configuration issue
- Network performance issue
For more information, please check “the top ten causes for a network slowdown”.
1 factor out of 7 is related to the network, 2 factors out of 7 if you consider DNS as part of the network infrastructure; nevertheless, the network team has to troubleshoot application slowdowns.
What are the network team’s options for troubleshooting slow applications?
2 major options
Depending on their scope of responsibility and culture, network teams will collect different sets of data and make different measurements :\
Option 1: get yourself off the hook! (or “It is not the network!”)
- You are in charge of network operations
- Your scope of responsibility is limited to the sole network
- You are not entitled to look any further than this!
In this case, your primary concern is to show that “it is not the network”: you will solve the case if it is network related and you will have got the job done!
What information do you need to get there?
- Precise measurement of where problems are occurring:
- Network latency (round trip times)
- Link load (percentage of bandwidth used)
- Retransmission rates/packet loss indicators
- Performance indicators for network devices (collected through SNMP)
- MTU values
- A representation system to show all of the data described above
- A data retention of at least 15 days
Option 2: Solve the case as much as possible and at least locate the root cause!
- You are in charge of network operations
- Your scope of responsibility is limited to the sole network
- You have the responsibility to solve the case and lead the troubleshooting involving colleagues from other departments wherever it is needed.
In this case, whatever the origin of the slowdown, you are in a better position to solve the case. WHY?
You are the best placed to gather all the information required to drive the troubleshooting: all the data exchanges which correspond to the slow transactions go through the network.
You have the possibility to have both a macro and micro view of all the elements that make up the application delivery chain.
OK, but how do I get that information ? Where should I start?
Step 1: Start a wide-angle view and then drill down.
You first have to take a big picture and locate where the issues appear:
- One or several applications
- One user, several ones, all of them
- One site, several, all of them
- One server or all of them
- The front server, the application server or the database and back-end servers
A matrix view can bring some answers: a RUM (Real User Monitoring) solution will provide you with a synthetic view of your application’s performance at a glance. As an example, get an overview of all the users accessing the application HTTPinterne (from all the user sites – as lines- to all the servers – as columns) and can pinpoint where the degradation is occurring: for the users located in Site1 to the servers in the Datacenter1 zone.
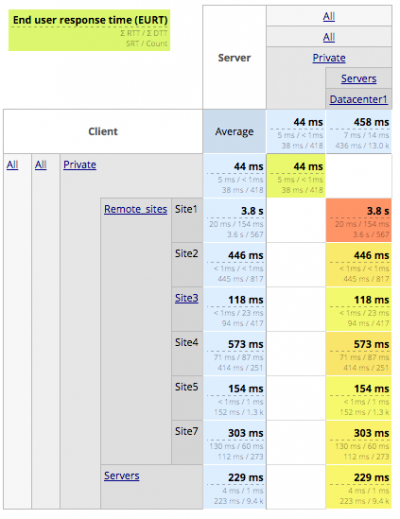
A 4 clicks-drill down will enable you to investigate cases from synthetic dashboards to the details of the impacted transactions.
Step 2: access the details
Is the degradation related to:
- One VLAN, several VLANs, all?
- A specific transaction (http page, hit, SQL query, SMB transaction, DNS query)?
As an example, through traffic analysis, we can extract the page load time for a given web page and the impact of every hit inside it.
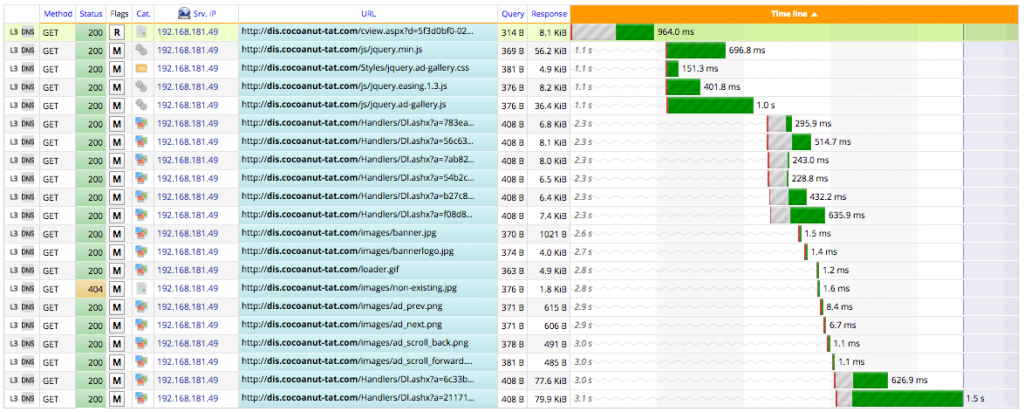
With an up-to-date network traffic analysis solution, flows get analyzed in real time from layer 2 to layer 7. All this information is qualified instantly through real-time traffic analysis.
Because as a network team you are the only one who can collect and make sense of the Wire data, you are also the only one who can lead a troubleshooting process which overlooks all the potential causes for application performance degradations.
You just need tools which make that job an easy task!