Accedian is now part of Cisco  |

4 Clicks to Drill Down

Discover the source of any performance degradation in seconds

Monitoring and Alerts

Receive alerts of performance degradations before end users complain

Most organizations struggle to handle end-user complaints regarding slow application or network services, a situation that is made worse by the complexity of today’s application chains spanning legacy and hybrid cloud infrastructure. Routing cases to the right team is therefore a major issue. Skylight transforms the way IT teams collaborate, how end-user performance is monitored, and how performance degradations are identified and ultimately resolved.

When performance degradations occur, Skylight alerts the helpdesk team and displays the following:

  • -Name of the impacted application
  • -Time of impact
  • -Origin of the performance degradation, whether it’s the network, a server, or an application service


Based on the nature of the evidence provided by Skylight sensor, the incident can be forwarded to the appropriate IT team for detailed diagnostics.


Receive alerts of performance degradations before end-users complain
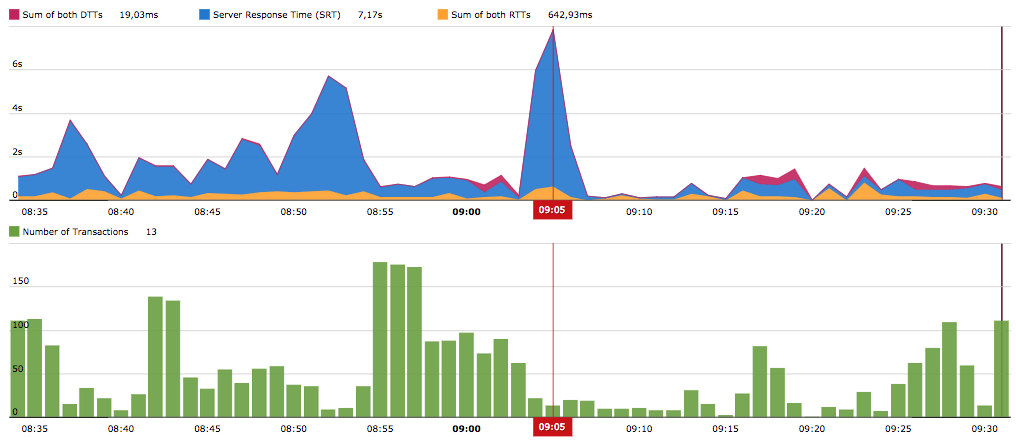
Skylight sensor’s dashboard displays end-user response time degradations for your business-critical applications and provides a clear indication of the origins of performance issues. In the above example, it is easy to identify a slowdown in server processing time is the cause of slow application performance.

Identifying

Determine the scope and origin of a degradation instantly
What is affecting the end-user experience? With a single click, Skylight sensor can drill down to provide more details about the end-user experience of a given application. Skylight sensor’s Application Dashboard first displays the evolution of end-user response times, broken down between network, server response, and data transfer times, along with the evolution of the transaction volumes for that application. At a glance, it becomes possible to understand what led to the degradation of the end-user experience and when it occurred.
Determine the scope and origin of a degradation instantly
By scrolling down, it is possible to know which server(s) and which user group(s) were impacted, and where they are located.

Analyzing

Diagnose affected users and the transactions involved
Clicking on a specific user group in Skylight sensor displays the users that are impacted within the group, the details of their application usage, and relevant performance indicators.
Diagnose affected users and the transactions involved
The above dashboard helps to compare end-user performance client-by-client and to identify users with abnormal response times and usage.

Resolution

Get to the root cause rapidly
Skylight provides the ability to drill down to the very details of each transaction at the network, TCP, and application levels, and to see exactly where the performance issue originated:

  • Client outage or slowdown
  • Network latency or packet loss issue
  • Server outage or performance degradation
  • Application response times

Skylight sensor provides an instant view of each user session with detailed records and packet tracing:

Get to the root cause right away
Only a single click is required to access the details of each application transaction (e.e., HTTP hits, HTTP pages, database queries, file transfers, etc.).
Get to the root cause right away