
 Cloud Visibility
 Application Performance
 Network Performance Optimization
 Industries
 Platform
 About Us
 Learn
Learn
 Blogs
Blogs
 Improved delivery, better visibility: How Accedian and VMware are working together to help CSPs navigate the 5G world
 Adding a new dimension of visibility to the Cisco Full-Stack Observability portfolio with Accedian Skylight
 Tools & Support
Accedian’s Skylight performance analytics product team is constantly coming up with new ways to provide amazingly efficient ways to spot network problems at both the macro or micro-detail levels. Here are a few that make us proud and our customers thankful!
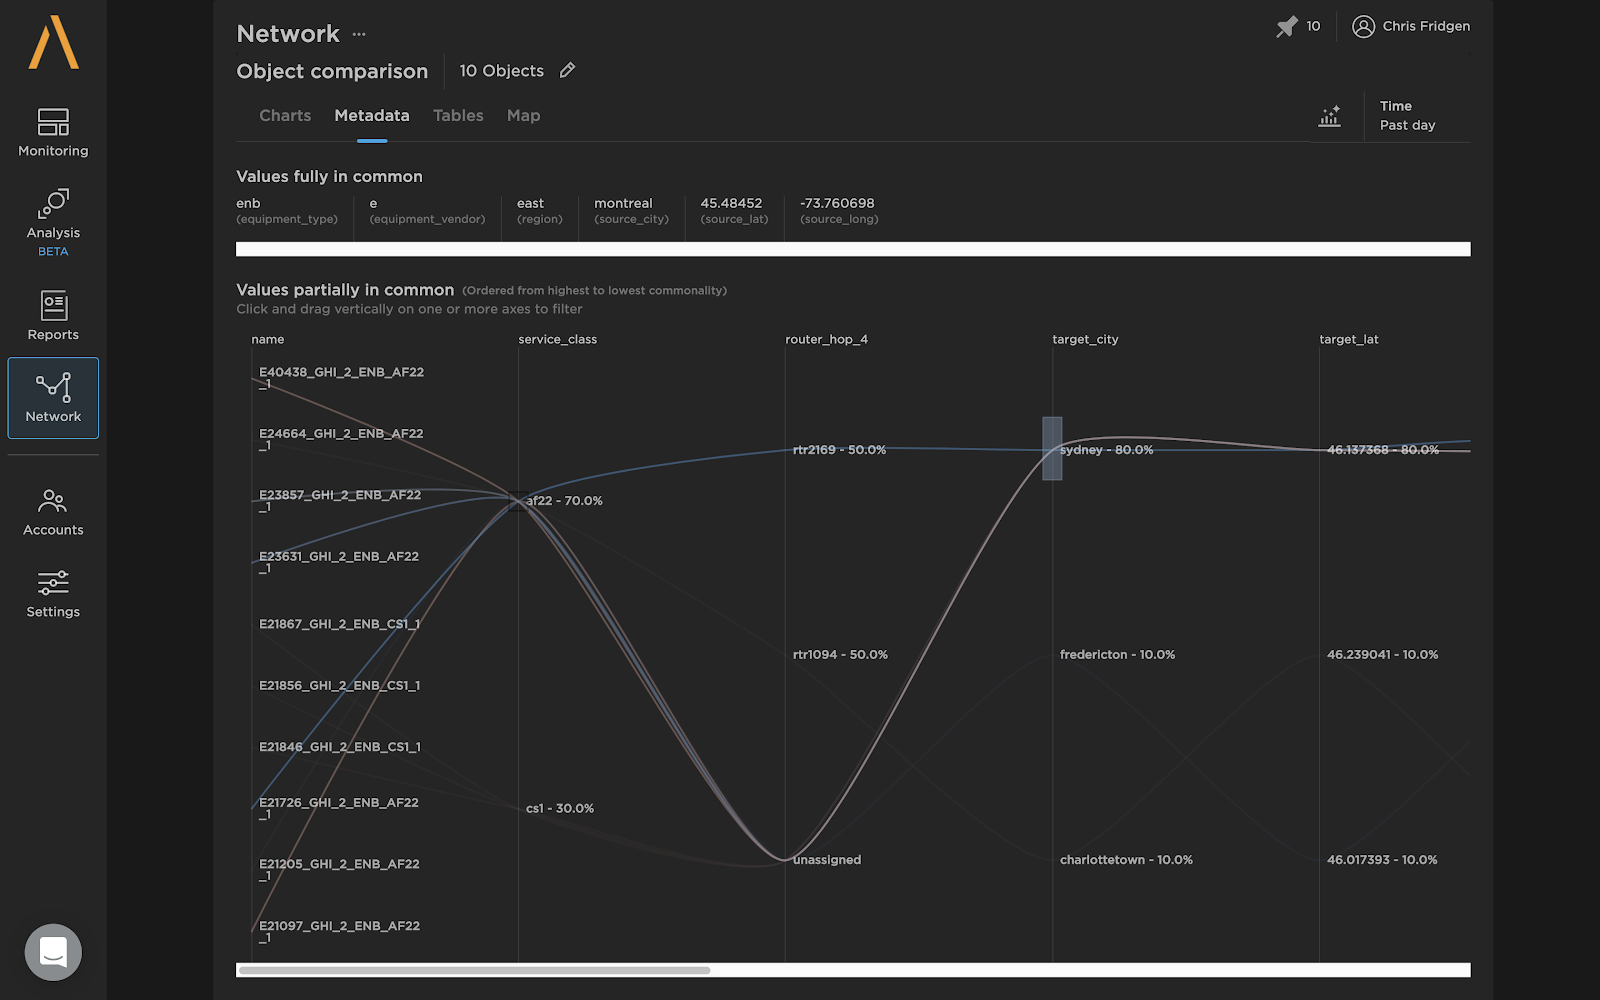
1. Parallel axis to visualize commonalities in metadata
A cornerstone to our analytics solution is the enhancement of performance monitoring (PM) data with categorical information or metadata. Topology, geographic, service, or customer information can be associated to synthetic session, passive capture or third-party time-series data which facilitates powerful correlation capabilities.
One tool that has proven to be very insightful is our metadata parallel axis feature that helps you visualize commonalities in the categorical information assigned to a group of objects. We like to use the term object (or monitored object) for anything that is being individually tracked or reported on – this could be a synthetic test session or port stats from a router.
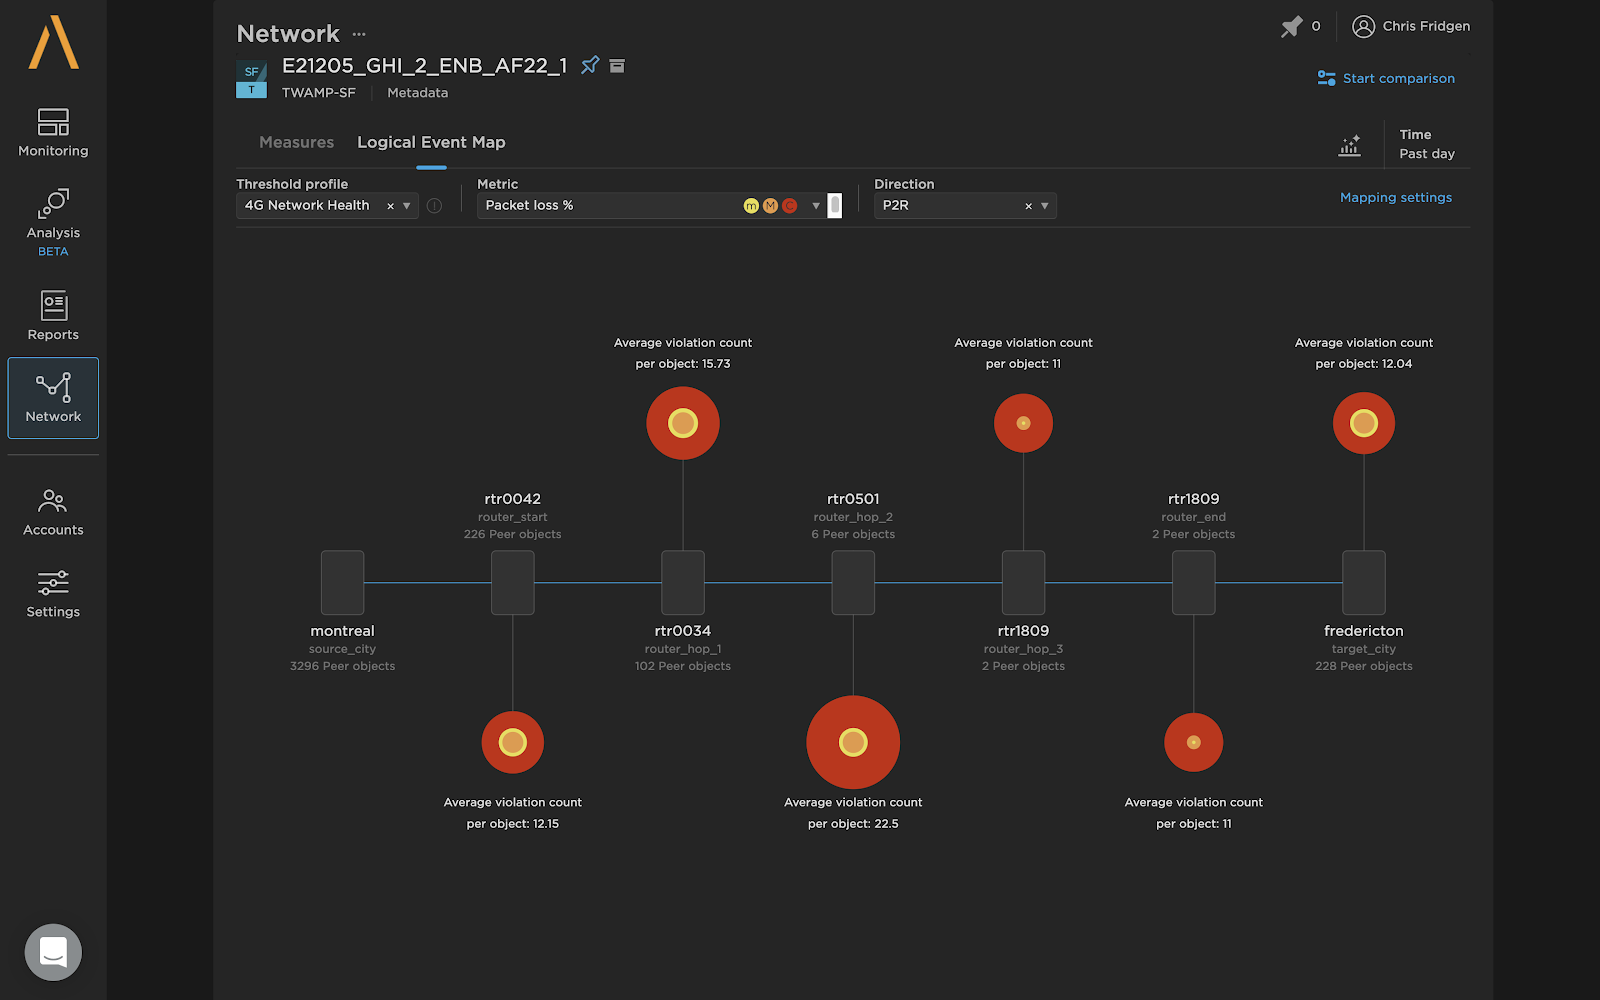
2. Logical event map to identify issues along a session’s path
A big problem during investigations is finding out how widespread an issue is, and where the troublemaker’s source might be. Using topology-based categorical information, the logical event map can look for correlations along a synthetic session’s path to find hotspots based on other sessions that might run through the same path. If you’ve got multiple sessions passing through a given element and they are all reporting problems (i.e. breaching metric thresholds), this visualization will help you spot that trend and give you a starting point to launch an investigation. In the image below, the larger the concentric circle around the element in the path, the greater the number of threshold breaches that sessions passing through it are experiencing.
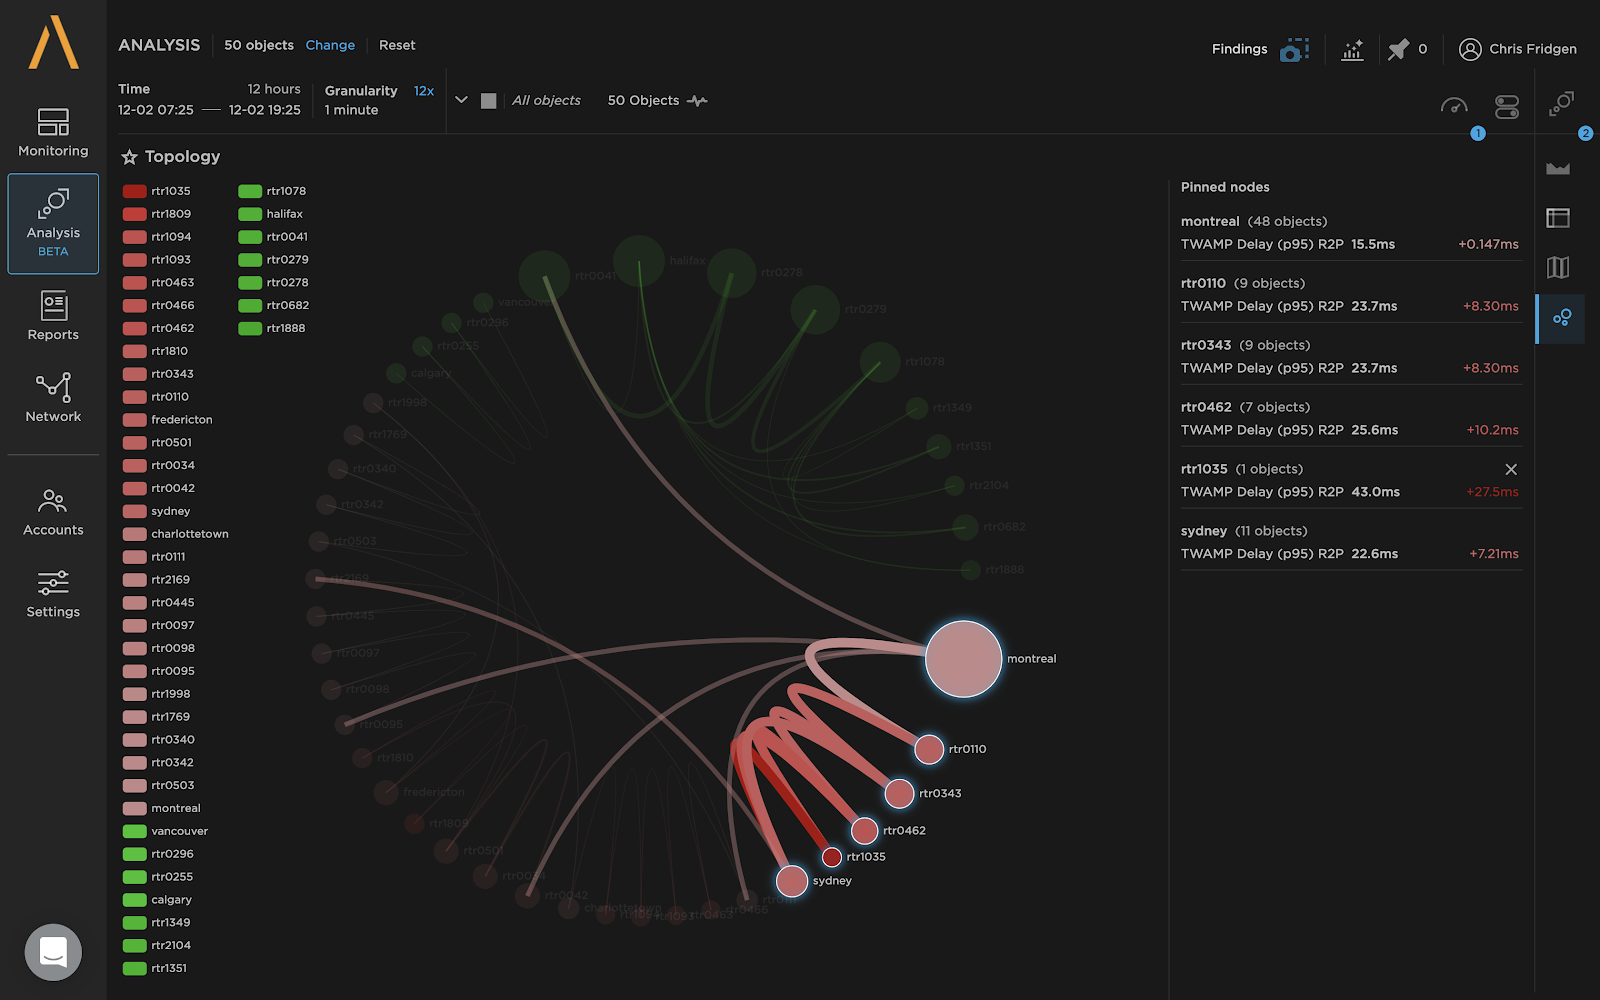
3. Topology insights to find the statistical weak spots in your network
Graph analytics is pretty popular for good reason! Understanding relationships across objects can bring significant insights and lead to improved decision-making and planning. Our topology insights uses some of these graph analytics practices in order to find locations in your topology that are associated with the poorest performance, and it can even tell you statistically how much latency, jitter, packet loss, etc. that a point in the path may be responsible for.
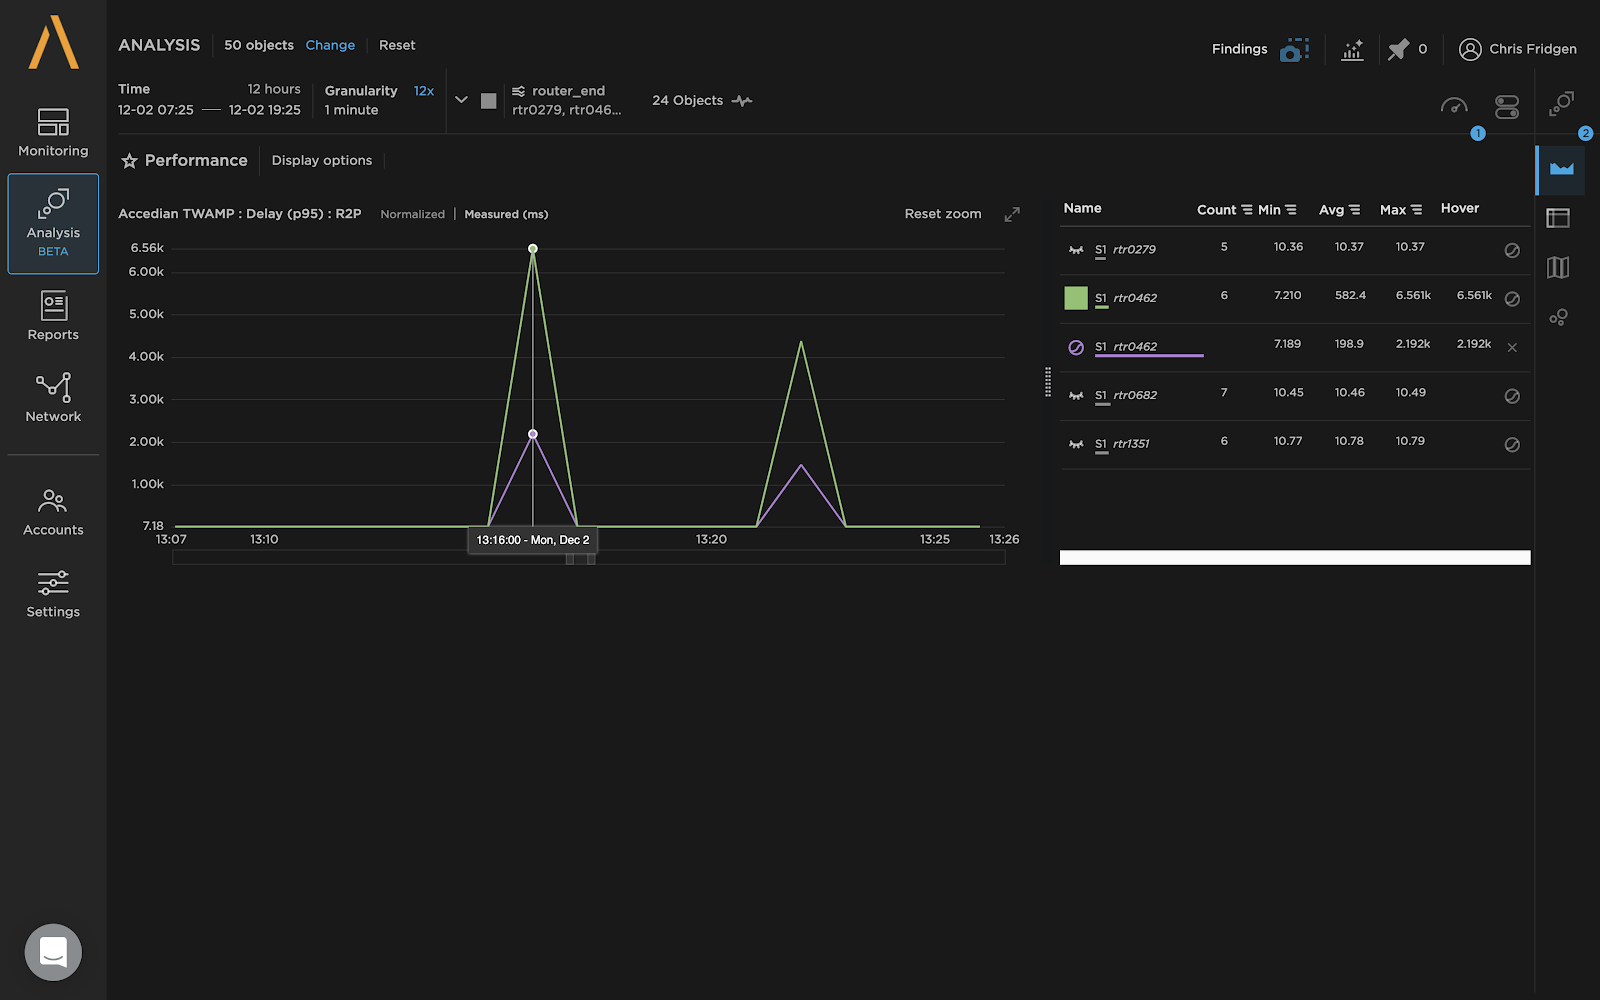
4. Reference lines in micro analysis to confirm trends and where to troubleshoot
So you’ve narrowed down the problem to a subset of objects (i.e. synthetic test sessions) in your network, what next? Try our micro analysis feature and be surprised at how that categorical data can allow you to slice and dice your object sets to look for trends. Find a subset of objects that look suspicious, pull in a reference line from the rest of the network based on the same metadata. Next confirm how localized the issue might be, and then decide whether you need to dive even deeper into the data.
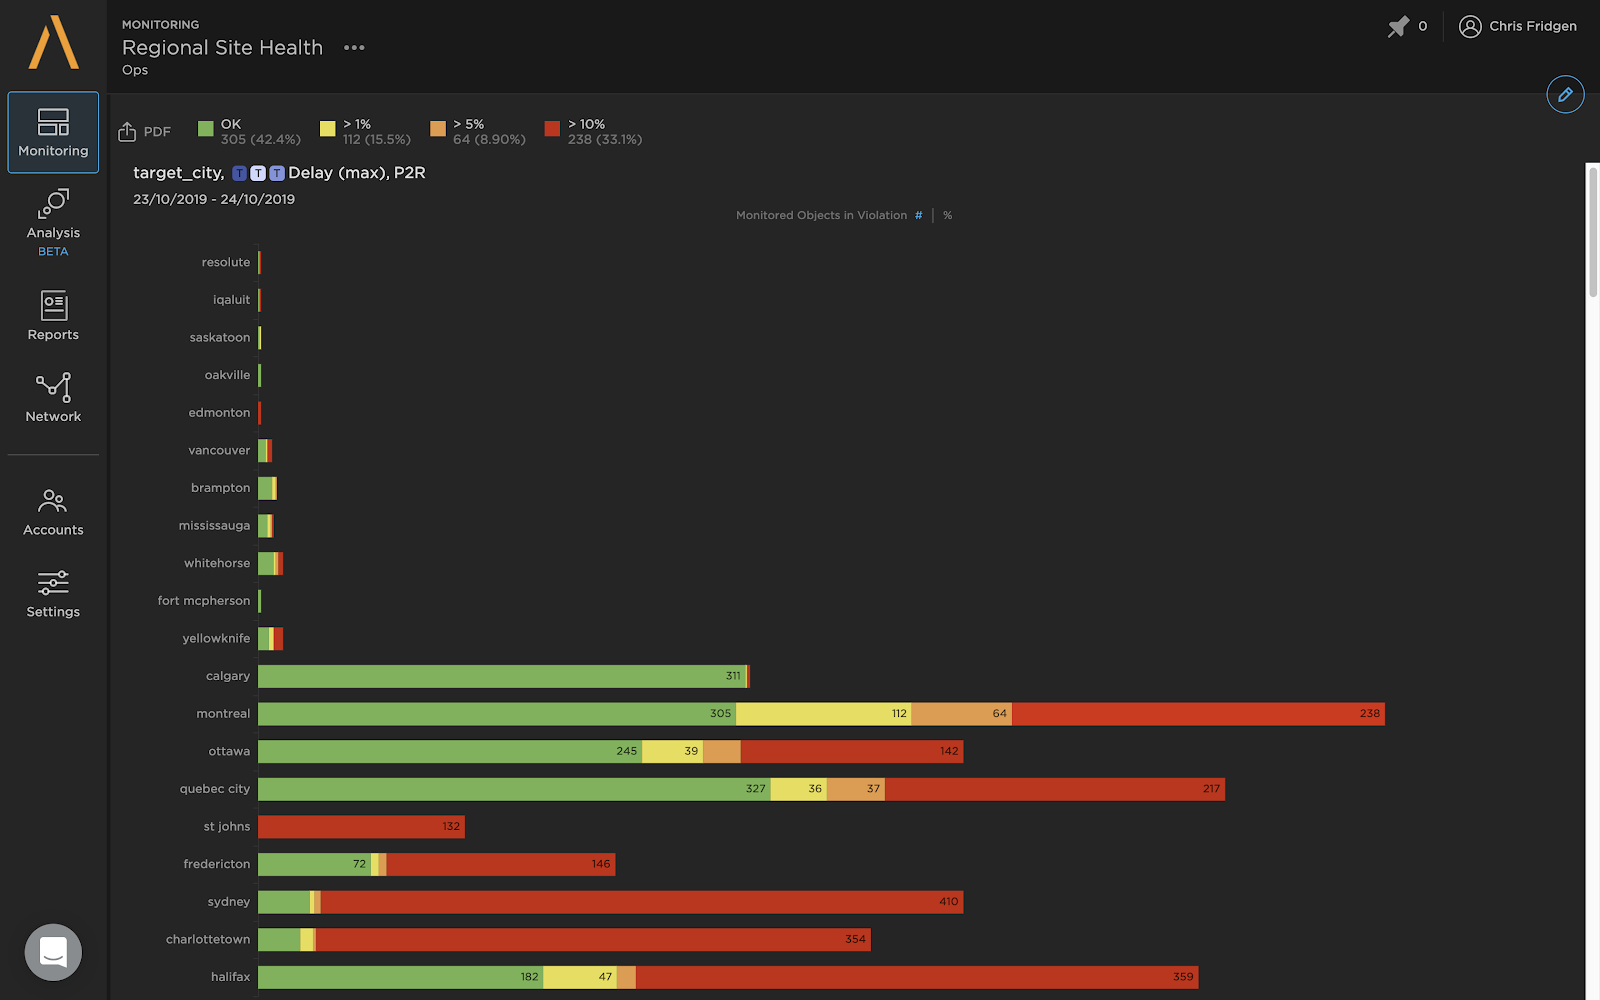
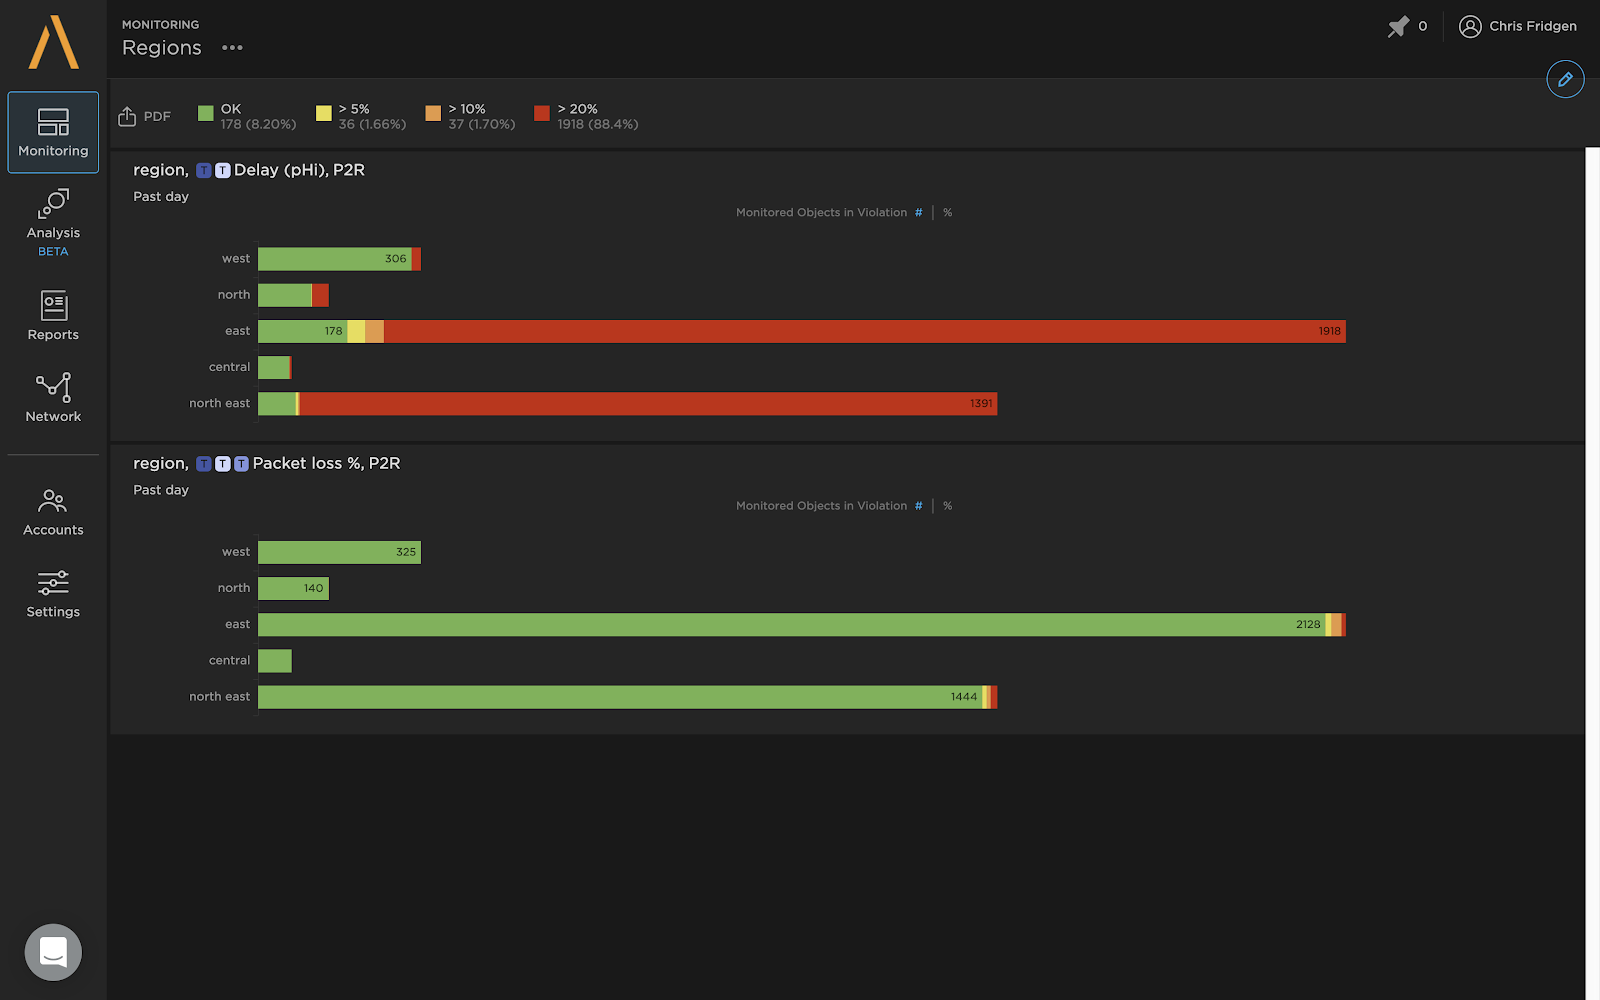
5. Object violation dashboard to visualize network hotspots and prioritize fixes
Let’s be honest, most networks run a little “red”, and finding areas to focus on can sometimes feel overwhelming. We created a purpose-built dashboard to help, shedding a light on the part of your network that needs you most. It allows you to visualize network health by how much time different objects spend in violation of the set performance thresholds and enables you to report on them by categorical information (metadata); for instance, which region or service has the largest proportion of time in the “red”.
We work very collaboratively with our Skylight analytics customers to experiment with new tools and workflows, as well as to hone existing ones so that we can make their lives easier. Come join us on this journey – we’d love to work with you to invent some new, never before seen tricks!
To get a deeper Skylight analytics demo, watch this video or contact us here.