
 Cloud Visibility
 Application Performance
 Network Performance Optimization
 Industries
 Platform
 About Us
 Learn
Learn
 Blogs
Blogs
 Improved delivery, better visibility: How Accedian and VMware are working together to help CSPs navigate the 5G world
 Adding a new dimension of visibility to the Cisco Full-Stack Observability portfolio with Accedian Skylight
 Tools & Support

Packet delay metrics can be more than just “delay“
The first thing that springs to mind when thinking about packet delay is measuring the impact on applications requiring a small delay, or the impact on the user experience. Few people understand that packet delay metrics can also be used to identify the root cause of many different network problems.
For instance, identifying the root cause for packet loss has always been a challenge. Is it a lack of bandwidth, a burst issue, a hardware fault or a network congestion point? Locating the problem locale is also a challenge. Delay can be used to troubleshoot the root cause for packet loss, routing issues, hardware issues and more.
Using delay metric patterns to identify root cause
Each issue root cause has a different signature that produces a specific pattern on different delay metrics. The signature for delay due to packet loss caused by buffers that are too large, retention limits on queuing or congestion due to network saturation are all different.
So, let’s dive into what these delay metics can tell you.
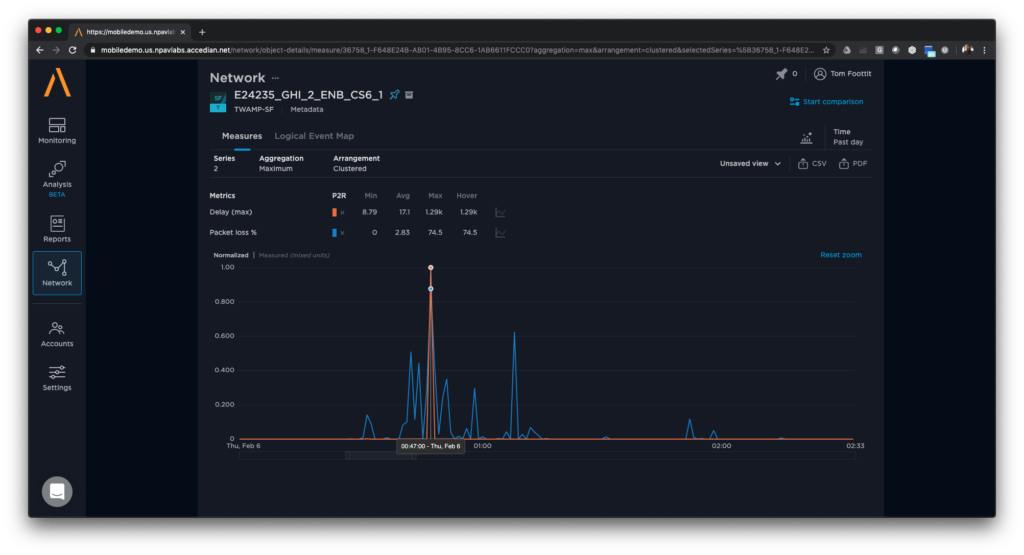
Maximum packet delay
- A high peak in the maximum delay is probably caused by buffers that are too large in the network. Upon congestion, the packet is queued for a very long period of time causing these high peaks.
- A plateau in the maximum delay is probably caused by reaching the buffer retention limits. The network is operating in a continuous congestion mode.
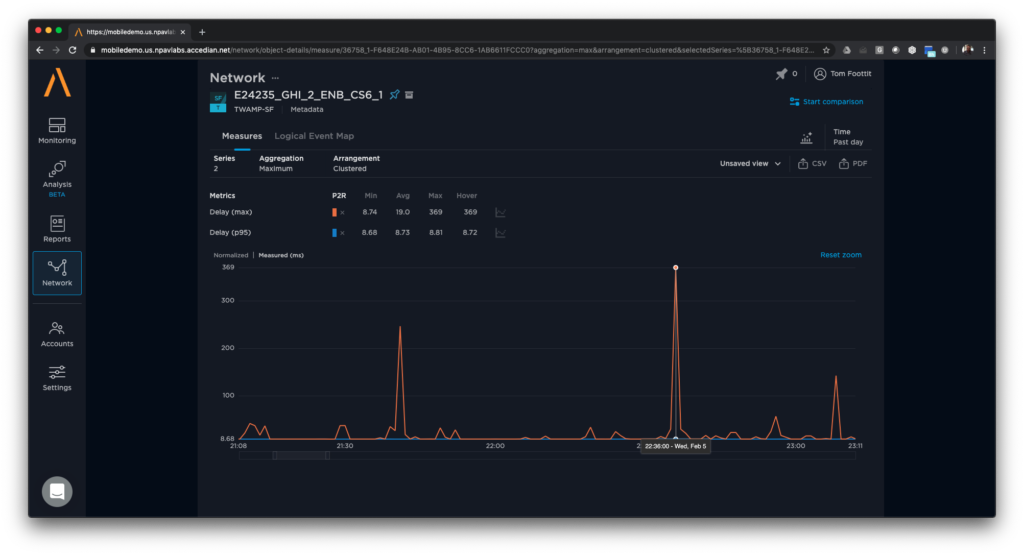
Packet delay percentile 95 (P95) to P99
- Percentile corresponds to the percentage of samples that are below a calculated value.
- P95 is used instead of maximum delay when the session is using software timestamping for delay calculation. The P9X removes the outlying results and focuses on the “real” maximum delay value.
Packet delay percentile 25 (P25)
- Packet delay P25 helps to identify congestion in the network. When variations are observed in the P25 delay, you can conclude that this is a signature of potential congestion in the network. 75% of the traffic in the network has higher delays.

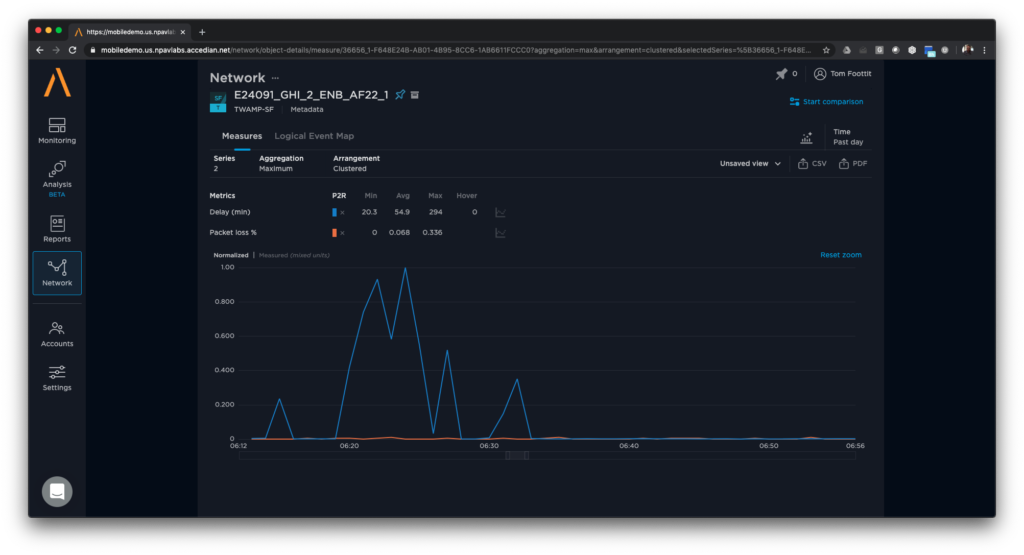
Minimum packet delay
- Minimum packet delay corresponds to the distance between two network end points—it is the time it takes for a packet to transit the network.
- A peak with a plateau in the minimum packet delay is probably caused by a routing issue using a longer path or network protection switch using a longer path.
Using Skylight performance analytics, the different patterns can easily be identified by visualizing specific delay metric graphics. By superimposing packet loss in each direction, maximum packet delay or P95 and P25 metrics in the same analysis, root cause can be identified. You can also leverage the AI features in Skylight performance analytics to detect when an identified pattern is recurring in time.

Monitoring different classes of services
Why does monitoring all classes of service have benefits? Networks with multiple classes of service should monitor different KPIs for high priority class of service vs. low priority class of service. Monitoring higher class of traffic is important. Packet loss or high delay on Voice over IP (VoIP) has a big impact on customer experience. The best effort class of service should also be monitored as this is an early indicator of network issues that may start to effect all traffic. The packet delay P25 should be monitored on the lowest class of service. When the delay P25 on a low class of service starts rising above your threshold, it indicates that 75% of the best effort traffic has a higher delay. It is an early indication of network congestion and should be monitored closely.
Within mobile networks, packet loss and packet delay are not symmetrical; therefore, defective hardware or transmission issues can be found by monitoring the packet loss and packet delay for both directions at the same time. When both directions show the same pattern, this is a good indication of defective hardware or a transmission issue (e.g. with a microwave link).
Accedian Skylight solutions can help you measure the performance of your network and also quickly identify the root cause of performance issues by leveraging our best in class performance data and performance analytics capabilities.