
 Cloud Visibility
 Application Performance
 Network Performance Optimization
 Industries
 Platform
 About Us
 Learn
Learn
 Blogs
Blogs
 Improved delivery, better visibility: How Accedian and VMware are working together to help CSPs navigate the 5G world
 Adding a new dimension of visibility to the Cisco Full-Stack Observability portfolio with Accedian Skylight
 Tools & Support
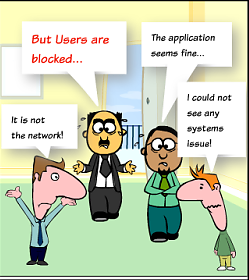
Finding the root cause of a network performance degradation (slowdown) is the bane of every network administrator. Who among them hasn’t heard this complaint: “The network is slow; I can’t even access my application to do my job!”
How can you figure out if there is an actual network performance degradation or if the slowdown comes from another IT system (e.g., front server, application server, database, client workstation)?
Which network diagnostic tool can you use to determine if there is a network performance degradation?
That’s a huge question… Your first target as a network administrator will be to show the other IT groups that there is no network congestion and that latency and retransmission rates are OK … and that they should investigate other parts of the application delivery chain. How can you do that?

Option 1: Should you capture and analyze network traffic?
Let’s go and capture some traffic!
You have Wireshark installed on your machine; let’s get ready!
Let’s select your number one complainer: we shall call him Bob. Follow these steps:
- Place a capture point (either using TAPs or SPANs) on Bob’s network connection as well as on the server side. This means that you may need 2 hardware probes / stream-to-disk
systems / packet recorders / traffic capture appliances to do the job. - You then realize that the network performance degradation is intermittent: you are going to have to let the probe record traffic for a good number of days… and ask Bob to carefully take note of the precise time of each degradation (which he is not likely to do ;).
- After 2 or 3 days of data capture, there comes the final battle: analyzing 2 multi GB trace files with Wireshark… is that doable? Not really…
- Let’s cut these in slices and calculate network response times manually …
- Afterward follows a long and relatively partial analysis of the PCAP files… 3 days after that, you have found no sign of network delay,
of bandwidth saturation, or of packet loss … but a good number of application transactions with a processingtimes in the tens of seconds! - We’ll put this together in a report and send it to the application team (with the feeling that they are not great fans of trace file reading and that they will consider the information with a certain level of suspicion).
Just get ready to do the same thing for all complainers and any incidents to come.
Option 2: Should you look into polling your network devices through SNMP?
As a great network administrator, you have implemented tools to monitor the availability and resources of your network devices (using either commercial software such as Solarwinds NPM, OpManager, What’s Up Gold, etc., or an open source solution such as Nagios, Cacti, PRTG, Centrion, etc.). Hopefully, the job of configuring the source device and the monitoring platform is already complete.
Now let’s take a look at the data. You see bandwidth and packet loss measurement, you can check that the resources (e.g., memory, CPU) are not saturated , but you quickly face some limits:
- The 5-minute intervals do not enable you to see any instant degradation
- The tool doesn’t tell you anything about network or application response times
- There is no way you can diagnose events that are specific to a destination or an application
Option 3: Placing robots/testers across your network?
As the performance degradations become recurring, you decide to deploy some devices to actively test the availability and performance of your network and applications. You distribute them at strategic user locations and start configuring scenarios that represent the most important parts of your users’ activities.. and quickly come up against the following limitations:
- Testing every 5 minutes isn’t relevant when you face intermittent performance degradations
- The problem that users complain about is never covered by your scenario
- The monitoring solution tells me when response times go up but it doesn’t tell me why they go up!!!
OR let’s take an hour and fix your problem with Skylight!
Accedian Skylight is able to record the traffic between all of your users and all of your servers—with no scalability issues—and measure the end user experience 24 hours a day, every day. With one appliance per data center, you will be able to:
- Visualize the evolution of the end-user experience
- Scroll back in time to determine which users, applications and transactions are experiencing performance degradations and when
- Pinpoint the root cause of the performance degradation (i.e., client, network, front server, database server, etc.…)
- View application transactions without having to analyze any packets
- Generate and automate reports with a single click
You will NOT have to:
- Configure and maintain any user scenarios
- Add or update any SNMP configuration for the devices
- Translate packet data for your application colleagues
Not only will you be able to convincingly demonstrate that the network is not at fault, but you will be able to help your colleagues positively figure out the source of the performance degradation.