 Cloud Visibility
 Application Performance
 Network Performance Optimization
 Industries
 Platform
 About Us
 Learn
Learn
 Blogs
Blogs
 Improved delivery, better visibility: How Accedian and VMware are working together to help CSPs navigate the 5G world
 Adding a new dimension of visibility to the Cisco Full-Stack Observability portfolio with Accedian Skylight
 Tools & Support
A critical aspect of network and application performance visibility is scalability, as it directly determines how much of the network and application can be monitored.
It’s also a key element in planning for the future as traffic volumes rise and application counts increase.
That being said, capture rate should not be the sole criteria when evaluating the scalability of a network and application performance management solution (NAPM). The volume of network traffic to be analyzed is only a useful indicator if the performance management solution is able to deliver on the following points:
- data is sufficiently precise for performing diagnostics
- data is retained long enough to provide historic trend analysis and performance baselines upon which to draw conclusions
- data can be captured at each and every location where it is needed to solve problems
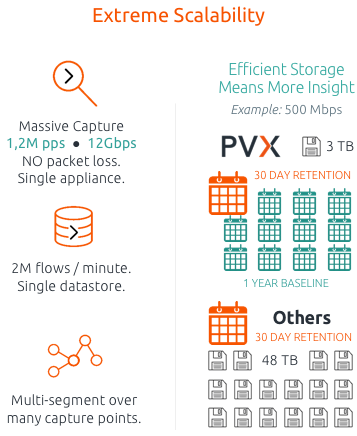
Skylight combines scalability, granularity, and data retention to provide IT professionals with the most effective way to diagnose network and application performance. Skylight offers:
- High capture rate: With all network and application decoders active, each Skylight appliance can capture over 1.2M pps (packets per second) with zero network impact, and every packet analyzed at wire speed
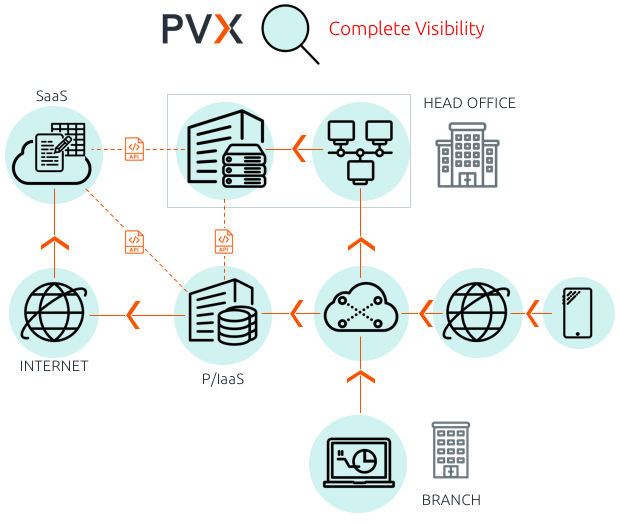
- Scalability: Skylight’s distributed traffic capture architecture easily handles dozens of connected appliances (physical or virtual) while providing centralized analytics, visualization, and management. Skylight provides access–and therefore visibility–on to all network and application data across data centers, virtualized and cloud environments, and branch offices
- Precision: Skylight provides the highest levels of granularity, retaining data to support the most detailed forms of analysis.
Skylight achieves this by aggregating trace files, generating more than 100 metrics for each Layer 3 session, and capturing detailed transactions and analytics for each application. There is virtually no limit to the volume of data that Skylight can process and analyze - Data retention: While maintaining reasonable levels of storage,
Skylight’s detailed troubleshooting data is retained for a month, while baseline data and performance statistics can be kept for up to 2 years
Unlimited Scalability for the Most Demanding Digital Infrastructure
Real-Time Performance Analysis With Fortune 50 Scalability
Skylight delivers industry-leading, real-time network and application performance analysis with near limitless scalability. Skylight traffic capture and datastore appliances integrate with any type of IT environment, from remote to central locations, across hardware, virtual, cloud, or software-defined infrastructure. See the Skylight solution overview for a full list of appliance specifications.

Scalability In Performance Management
Skylight outperforms the network and application performance management (NAPM) competition with real-time, 360° coverage of all network and application transactions across layers 2 through 7, at more than 10 Gbps on a single appliance. Skylight delivers significantly higher performance rates than competing solutions in production traffic conditions, with all protocol decodes activated.
Skylight computes performance metrics for all network flows and application transactions in a single pass—all in real time.
Competing solutions typically limit available visibility to “Top N” applications, or require two steps: packet collection followed by time-consuming post-mortem analysis. This approach impedes the ability to quickly analyze performance issues and increases the time required to bring issues to resolution. It also limits the extent to which IT can diagnose degradations, as many queries take too long–or insufficient data is available–to return insight.
With Skylight providing performance metrics on the fly across all layers, and over the entire application stack, IT professionals can troubleshoot and resolve performance issues with ease.
Monitoring and Measuring Network and Application Performance in Distributed IT Environments
For complex IT environments such as distributed data centers and multiple branch locations, it is possible to deploy multiple Skylight appliances—hardware or virtualized—across the IT infrastructure; collect network and application performance data to generate real-time wire data analytics in each appliance; and then aggregate those into a central datastore appliance.
IT professionals can visualize all network traffic and application transaction performance metrics through a single unified graphical interface via the datastore, which also provides centralized management for each traffic capture appliance that is deployed.
To enable essentially limitless scalability for the most demanding enterprise environments, it is possible to deploy multiple Skylight datastore appliances.
Precision Network and Application Performance Monitoring and Management
Performance Metrics at Full Wire Speed
Skylight identifies, classifies, and measures all network flows and all application transactions in real time. Every detail of every application session is analyzed—at over 10 Gbps per capture appliance with support for 40 Gbps links—with zero impact on production traffic. Skylight continuously measures network health, application response times, and transaction details.
Diagnosis of end-user complaints can be performed without any manual packet analysis. An intuitive interface reduces drill-down from business level views to detailed network, TCP transport and application levels within a few clicks. Having both network and application performance metrics available in a single solution and interface significantly accelerates application and network performance diagnostics.
Current performance issues can be compared to historical data on a daily, weekly, monthly, or yearly basis to accelerate troubleshooting and resolution. Historical data can be retained for up to two years to help in identifying long-term usage trends.
Retention of long-term statistical analysis typically requires terabytes of storage. This data must be retained over extended periods of time to expose overall trends. To minimize storage requirements while still making it possible to reveal trends over weeks, months, or even years, Skylight summarizes historical data automatically using an efficient, aggregation process. The result is complete look back details in a fraction of the space consumed by stream-to-disk systems.
Whenever Skylight displays a chart or a table, it calls upon data that has already been aggregated. To display the requested information, Skylight first determines the required level of aggregation granularity to use, depending upon both the length of the reporting period requested and how far back the available data goes. The result is answers in seconds, where other solutions take minutes, hours, or days to return results.
Wire data is analyzed at microsecond intervals when computing performance metrics. This offers exceptional accuracy, providing the ability to detect short term degradations that would otherwise remain undetected. Performance metrics and detailed transactions are losslessly relayed to the datastore every 60 seconds.
Up to Two Years’ History at the Click of a Mouse
Skylight offers three levels of granularity to deliver extensive, in-depth network and application performance history:
- 1-minute intervals, for up to 1 month of in-depth history
- 1-hour intervals, for up to 100 days of medium-term analysis
- 1-day intervals, for up to 2 years of long-term history
Once a given level of granularity has reached capacity, the oldest data is automatically moved to the next level in a process that is completely transparent for the end-user.