
 Cloud Visibility
 Application Performance
 Network Performance Optimization
 Industries
 Platform
 About Us
 Learn
Learn
 Blogs
Blogs
 Improved delivery, better visibility: How Accedian and VMware are working together to help CSPs navigate the 5G world
 Adding a new dimension of visibility to the Cisco Full-Stack Observability portfolio with Accedian Skylight
 Tools & Support
How fast can something go wrong in your network? And how quickly would you notice? More importantly, would you notice and be able to fix the problem before your customers experience it?
These are the types of questions that service providers should ponder if they’re serious about delivering connectivity services to the enterprise market, where the ability to meet demanding SLAs for performance and uptime differentiates the leaders from the laggards. For example, in highly automated “Industry 4.0” factories, many applications, such as industrial robots, have latency limits ranging from 2 milliseconds (ms) to as little as 125 microseconds (μs), and in financial services networks, trading applications typically have requirements between 1 ms and 1 μs, which is not speed for speed’s sake, but rather a path to achieving their business goals.
These latency-sensitive and mission-critical services and applications are also multi-domain, frequently spanning multiple sites, both physical and virtual. This includes branch offices and cloud data centers, as well as multiple network domains including the edge.
To get and stay competitive in the enterprise market, service providers need a carrier-grade service assurance tool that is accurate, real-time, and builds a statistical model of the network and services to understand current behavior and predict future behavior.
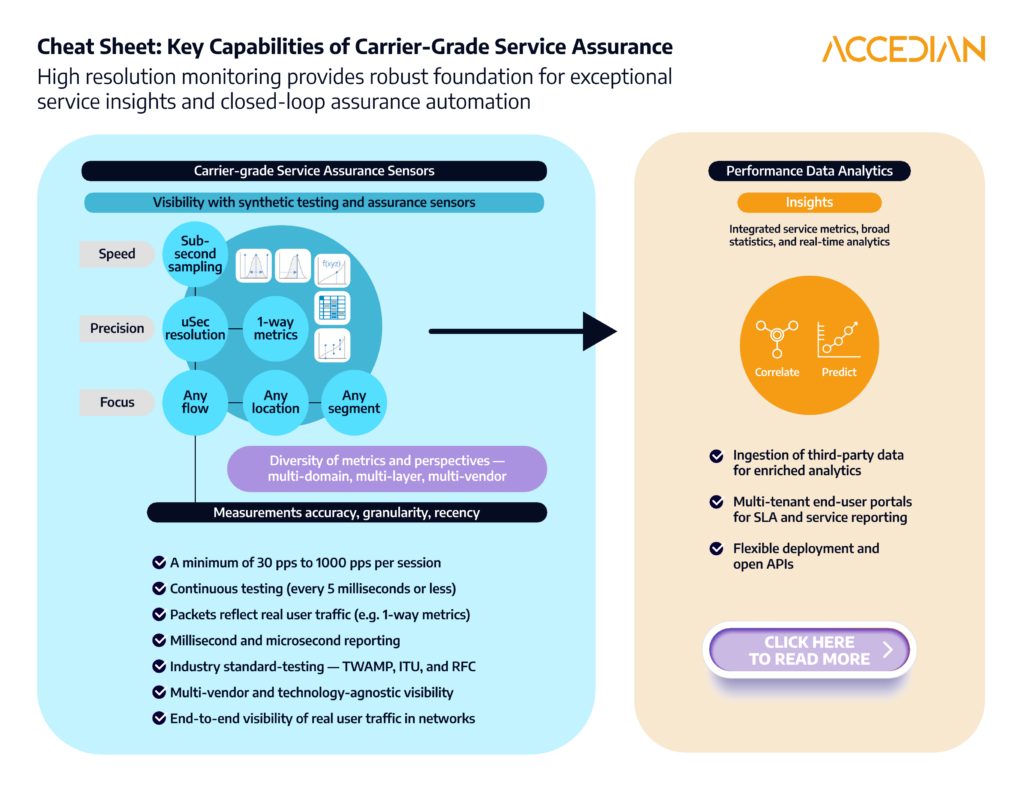
Here are eight must-have features and capabilities to look for when choosing a carrier-grade tool:
1. Synthetic packet testing
There are three key things to look for: (1) the quantity of packets per second (pps) that can be generated at a point in time, (2) the frequency at which this quantity of packets can be generated, e.g. once a minute, once a second, once every 100 ms, and (3) the characteristics of the packets to reflect actual user traffic.
- A minimum of 30 pps to 1000 pps per session is ideal for supporting 5G’s ultra-reliable low-latency communications (URLLC) and SLA reporting for business-critical applications. In addition to providing traditional latency, jitter, and packet loss measurements, a variety of delay-related percentiles can be calculated from these measurements to enable greater visibility into anomalies and recurring issues. All of these models enable insights such as congestion prediction and identification of path changes, as well the ability to build network quality KPIs.
- The frequency of tests should take place continuously (every 5 milliseconds or less) so performance issues that impact QoE of services and applications will not be missed. For edge compute applications, performance degradation detection will need to take place at the speed of human perception for critical public safety and emergency response services, and even for serious gaming! Running a high packet per second test once a minute will miss transient performance impairments that are not persistent.
- Lastly, the packet characteristics should reflect the real user traffic as much as possible (e.g. VLAN tagging, DSCP marking, packet size modulation). One way measurements as opposed to round trip measurements are important as often networks are asymmetrical and do not have symmetric paths for send and receive, making round trip tests (RTT) unreliable for understanding the true nature of the network performance.
2. Millisecond and microsecond reporting
Reporting on performance is different from measuring the performance. End-user customer reporting portals should offer options of defining the granularity of measurements being reported based on use case. They should also allow flexibility to roll up the time frames over a time period if desired to reduce data retention costs.
3. Industry-standard testing
The ideal tool supports a wide variety of telco industry tests and protocols, such as ITU and RFC. The Two-Way Active Measurement Protocol (TWAMP) is particularly important for providing microsecond-level visibility. Standardized tests provide a “common language” and enable service providers to offer consistency when reporting on SLAs to both enterprise customers and other service providers who may resell their network services.
4. Multi-vendor and technology-agnostic visibility
Service providers increasingly need to monitor all types of vendor equipment in the network, not only traditional telecom vendors. This needs to include IT suppliers that have entered the telecom market to capitalize on trends such as virtualization and O-RAN.
This flexibility also enables service providers to use the same assurance solution across their legacy and next-gen technologies, for example, a mobile operator could deploy assurance as part of its 5G buildout but also use it to assure services for 4G customers, such as industrial IoT and mobile broadband.
5. Ingestion of third-party data for enriched analytics
The ability to ingest data from other vendors’ infrastructure and analytics platforms as well as other time series data (power consumption, weather, network topology, etc.) enables the tool to provide a much more comprehensive picture of network performance and user experiences, as well as conduct machine learning and pattern matching to identify anomalies. In addition to minimizing blind spots, this single-pane-of-glass view eliminates swivel-chairing and the need for engineers and other staff to learn and operate multiple tools.
For example, Skylight uses the OpenMetrics standard for arbitrary time series data ingestion from sources such as routers and RANs to compare and correlate what its sensors, or probes, are finding. This helps ferret out anomalies, facilitate root cause analysis and identify nascent problems before they begin to impact enterprise customers.
6. Multi-tenant end-user portals
This provides another single-pane-of-glass view by aggregating all network services insights for end users. It also supports role-based access control (RBAC) and single sign-on (SSO) and enables service providers to offer enterprises their own individual portals for monitoring SLAs, as well as using same per-customer SLA data and insights for their own internal teams.
7. SaaS and on-prem private cloud deployment options
Look for a performance analytics tool that is cloud-native, scalable and available as a subscription service. These features ensure that the tool can meet company and regulatory requirements for security and data sovereignty.
8. End-to-end visibility of real user traffic across networks and applications
For example, Accedian Skylight’s software sensors can analyze 100% of all packets rather than simply sampling or topping (e.g. looking at the top X number of items in a list). Skylight then calculates delays across the entire application delivery chain (e.g., HTTP, SQL, DNS, TLS, FTP) to determine where time is spent in client-server communication. This approach is key for quickly pinpointing where performance issues are occurring, such as the front end, back end, and DNS, for example, and determining whether the root cause is the network, infrastructure, or the application.
Finally, these eight ‘carrier-grade’ assurance capabilities set the stage for high quality performance data and insights needed for automated service assurance, which is rapidly becoming the only viable way for service providers to monitor, manage and optimize networks to meet enterprise SLAs, and enable new business models and revenue opportunities.
Learn more about automated service assurance and how Accedian Skylight adds carrier-grade, granular and real-time service assurance to the Cisco Crosswork Network Automation Platform.